 METRIS™
Discuss an AI decision →
METRIS™
Discuss an AI decision →
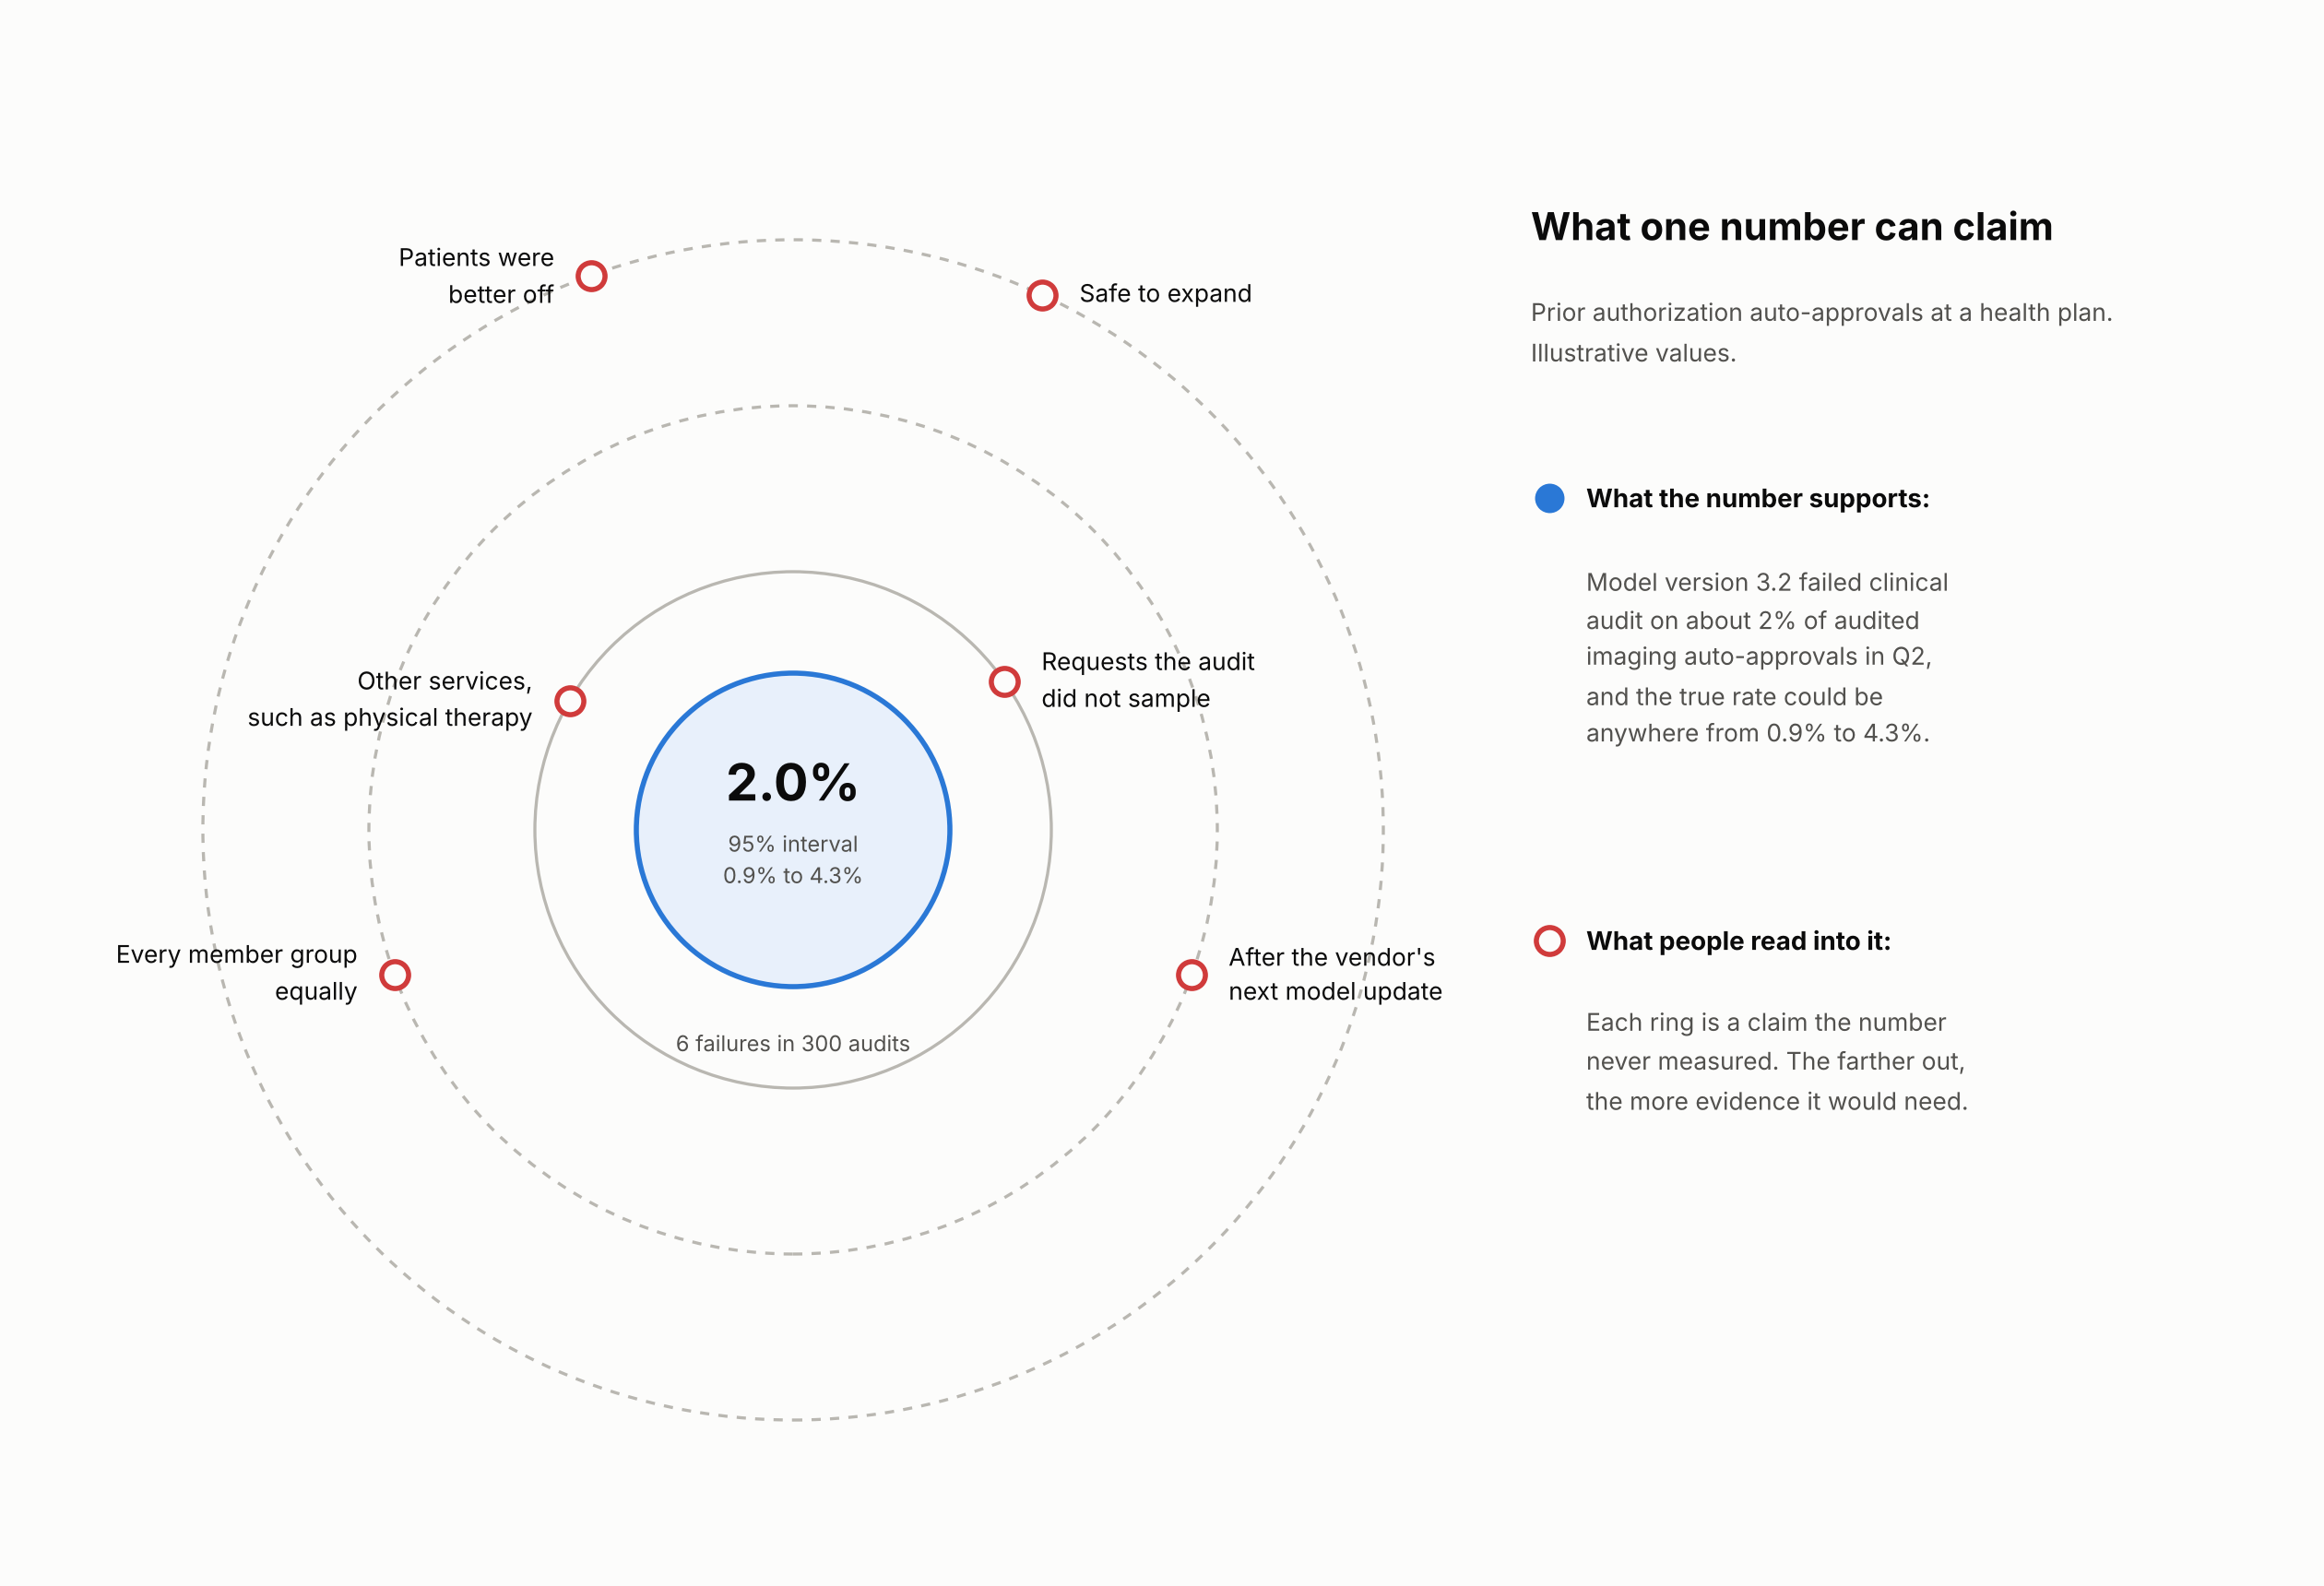
When an AI dashboard shows a good number, the usual assumption is that the number vouches for the AI. I would say the number vouches for something much narrower: one question, asked about one model version, on one set of requests, over one period. Everything beyond that is a claim the number cannot support. Those claims are exactly the ones that end up in board decks.
Return to the health plan from the first post. Its AI auto-approves prior authorization requests that clearly meet clinical criteria, and clinicians audit a sample of those approvals. In the second quarter, clinicians audited 300 imaging auto-approvals and found 6 that did not meet criteria. The data science team reports a failure rate of 2.0 percent, right at the plan's tolerance.
The number answers one question, and the question has edges
The 2.0 percent supports one sentence: model version 3.2 failed clinical audit on about 2 percent of audited imaging auto-approvals in the second quarter. Every word in that sentence marks an edge. Version 3.2 means the vendor's next update starts the count over. Audited means the number describes the requests the audit sampled. If auditors pulled mostly routine cases, the number says nothing about the difficult ones. Imaging means physical therapy was never measured. Second quarter means it was true then.
Within weeks, the same number reaches the quarterly report as "AI approvals are 98 percent accurate." A month later it becomes the argument for extending auto-approval to physical therapy. Each retelling adds a claim, and nobody measured any of them.
The 2.0 percent could be 4.3 percent
Six failures in 300 audits is a small count. A standard 95 percent interval for that result runs from 0.9 percent to 4.3 percent. In other words, the true failure rate could plausibly be more than double the plan's tolerance. The point estimate sits on the line, and the evidence doesn't say which side of it the model falls on. Reading the decision off the interval rather than the point gives an honest answer: watch, not pass. Reporting 2.0 percent alone gives a confident answer the data does not support.
A good number in one dimension can hide a bad one in another
The audit rate measures one thing: whether auto-approvals met criteria. It doesn't measure whether they met criteria equally often for every member group, or whether the rate holds after the vendor retrains the model. Those are different questions, and each needs its own measurement. Researchers who evaluate AI separate them for this reason. Accuracy, fairness and robustness each license a different claim, and none of them stands in for the others. An overall 2 percent can sit on top of a much higher rate for one group of members. The overall number will never show it, because it was never asked to.
What to do this month
Take the most important AI number in your next leadership report and rewrite it as a full sentence. Name the model version, the requests it covers, the period, and the interval around it. Then list three claims people are already making from that number that the sentence does not support. That list is your measurement backlog.